

(Editors Note: This is a reprint of a section of the earlier TWP article Are Voting Machine Conspiracies A Ruse? (Hush, Hush) – Part 4: Democrats & Dominion.)
You have probably seen one by now. It seems to be a tradition after every election night. Viral videos seeming to show votes being “flipped” or deleted in real-time on vote count graphics during election night news coverage.
It happened again the night of the recent California governor recall election, and proponents of the voting machine theory point to this as proof positive that illicit vote changes via electronic hacking are being captured in real-time.
Seems pretty convincing. What else could it be other than election officials or hackers changing vote totals that are being reflected in real-time, right? This is what I like to call the “Skynet Theory”. Presumably there’s a central database repository somewhere where official tabulation of all votes is happening. The CNN chyron and vote count graphics of other news networks are hooked directly into this same database, and the public can see changes being made in the database in real-time. That simply is not the case.
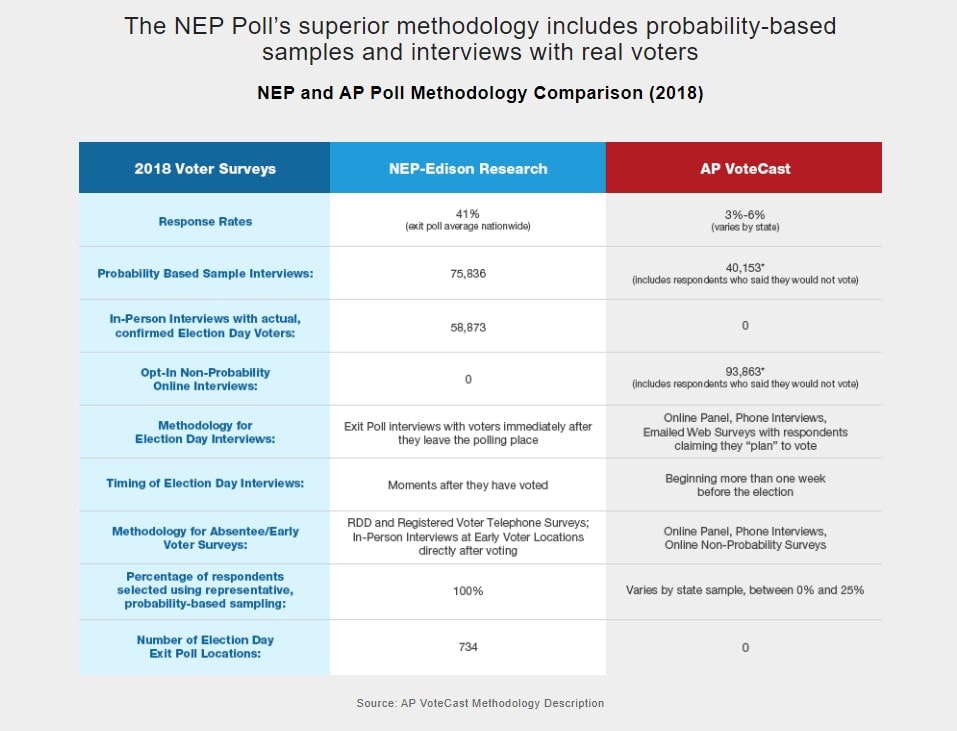
CNN and most of the mainstream news outlets all collaborate as the “National Election Pool” (NEP), and all get their data from a single source, a third party media research company called Edison Research. Edison “scrapes” data from different state and local data sources, aggregates it, and then using an algorithm to project the current vote totals. While the methodology is an improvement over exclusively relying on exit polling or other methods, it still incorporates exit polling data and voter surveys into the vote totals being displayed live on air.
Bottom-line: You are still looking at vote projections, not official or even raw vote totals being reported by government election sources.
There can be a variety of reasons for what would appear to be strange updates in the displayed vote totals. There is no degree of a seamless and uniform method of data aggregation. The “data scraping” is occurring on a variety of different sources, most often extracting data directly off web pages that will vary wildly in their design. A particular county’s website might be midway through its own process of updating at the moment the NEP sweep occurs, and would appear as if votes are being deleted from a prior update.
As mentioned earlier, exit polling and voter surveys make up part of the algorithm. I will not go too far into the wonky details. If you wish, you can go read for yourself. But for a quick illustrative example, if new voter survey data feeds into the algorithm in between graphic changes and adjusts the projected candidate vote percentages for a given area by 0.2% without changing the overall total votes:
Total Votes: 50,000 x (Biden 45.5% / Trump 43.5%)
= Biden Votes 22,750 / Trump Votes 21,750
to
Total Votes: 50,000 x (Biden 45.7% / Trump 43.3%)
= Biden Votes 22,850 / Trump Votes 21,650
Someone watching the CNN chyron changing when the example above occurs might view it as 100 votes being flipped from Trump to Biden. With DVR technology, they can make a quick TikTok video and suddenly you have viral evidence of electronic election hacking. The corporate media could easily explain this and put the controversy to rest, but the videos perpetuate the voting machine conspiracy and keep attention away from absentee ballot fraud. So they really have no incentive to do so. They are happy to keep feeding the beast because it helps their side win.
At the end of the day, these are not even unofficial vote totals from government reporting sources. It is a haphazard vote projection aggregated from a variety of different sources by a third party vendor. It is not how the final results are determined or reported.
The graphs above are from hour-by-hour (and sometimes minute-by-minute) updates of data that is desperately being acquired as quickly as possible. Due to the various different ways counties report data this is a partly manual process, and mistakes are made, then later corrected.
But the final result comes from pieces of paper that can be verified and recounted.
Mick West from Metabunk.org
Follow me on Parler @BoumtjeBoumtje
Follow me on Truth Social @AdamCarter


