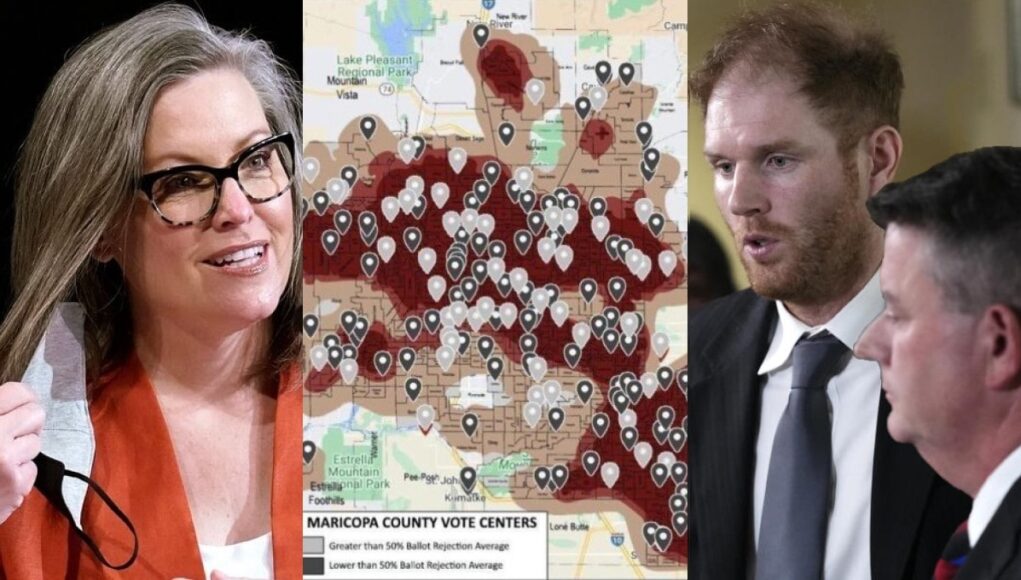
Last week at the “Save Arizona” rally, Republican candidate for governor Kari Lake made a startling revelation. She started by showing a picture of the “Heat Map” of Republican voter turnout located in the Maricopa County Tabulation and Election Center (MCTEC). The heat map was first disclosed by Richard “The People’s Pundit” Baris, and reported on by UncoverDC (UDC) & The Washington Pundit (TWP).
Lake next showed a map of voting centers that experienced the highest rejection rates of ballots being run through tabulators on Election Day 2022.
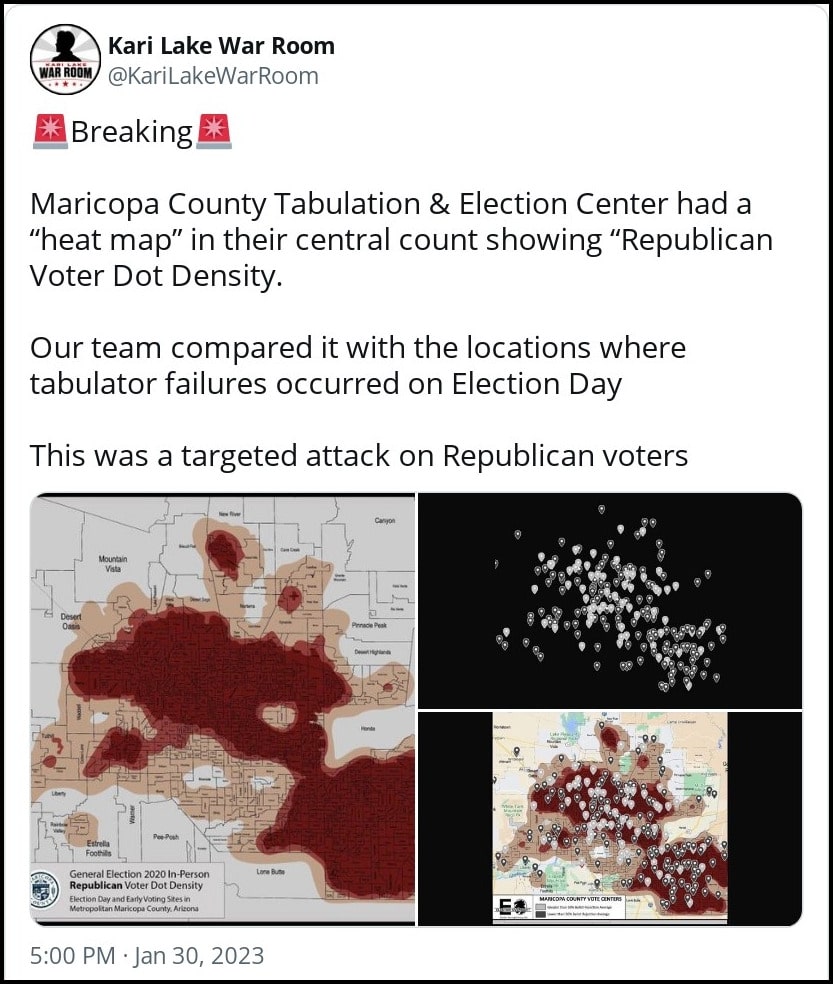
When the two maps were overlaid, the results—though not completely unexpected, as Baris had alluded to it on his Inside The Numbers podcast—were stunning nonetheless.
A closer look at the map really tells the tale. The red “pins” represent the Voting Centers that had a 50% or higher ballot rejection rate with their tabulators. The blue pins represent locations with lower rejection rates, but still experienced issues. The Voting Centers with the highest rejection rates almost entirely fall within the heaviest concreted Republican areas or just on the outskirts.
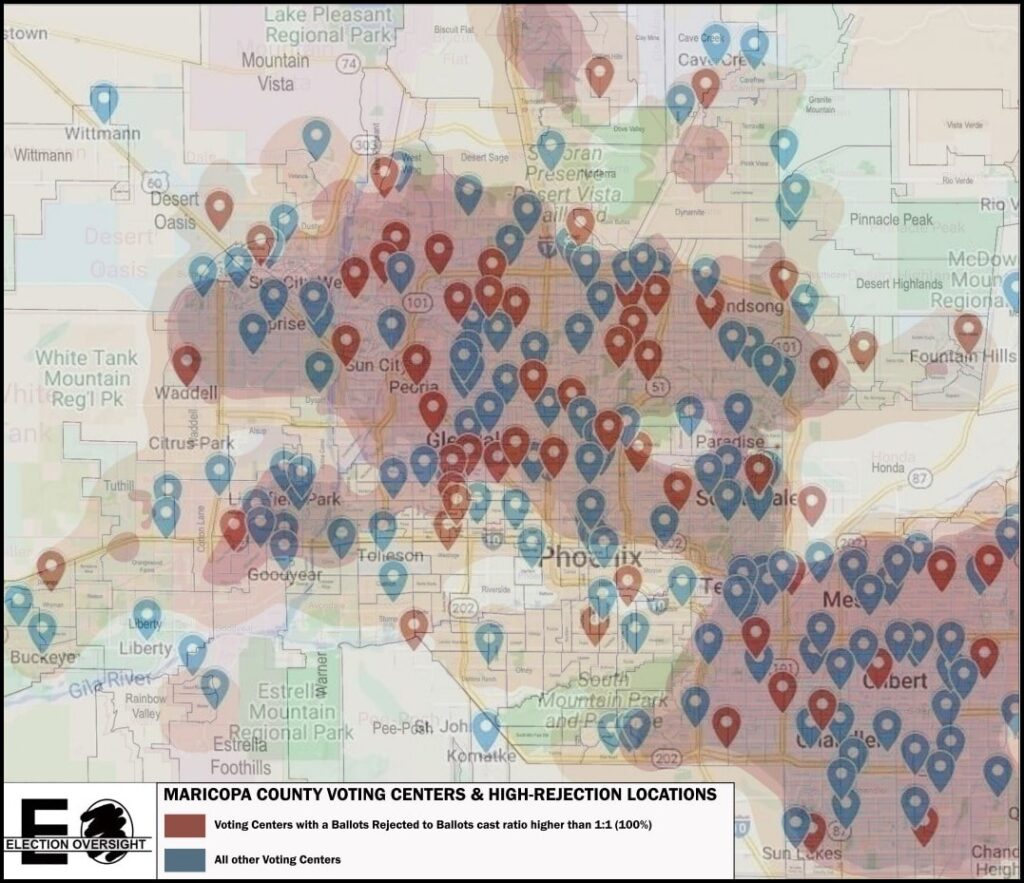
Since Rich Baris and UDC & TWP first broke the MCTEC heat maps story, a lot more information has come out—not much of it good for those running Maricopa County elections. In response to UDC & TWP’s article, Just The News (JTN) reached out to Maricopa election officials about the purpose and source for the heat maps.
A Maricopa County Elections Dept. spokesperson provided JTN with pictures, including one showing three separate heat maps, and explained:
“In the MCTEC hallway, we have a [Blue] Democratic In-Person Voter Turnout Map, a [Red] Republican In-Person Voter Turnout Map, and a [Purple] All Voter In-Person Turnout Map.”
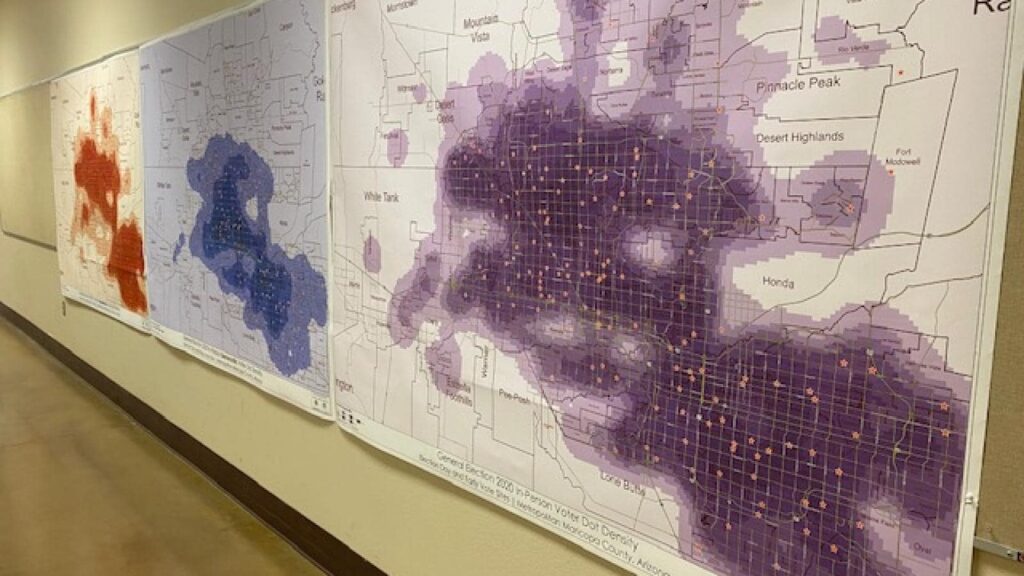
The Elections Dept. spokesperson went on to explain the Maricopa Recorder’s Office actually maintains an internal function to produce the maps stating,
“The Maricopa County Recorder’s Office has a Geographic Information System (GIS) team that makes all of the maps in-house. We use the turnout data by party for elections such as the Presidential Preference Election, which is a party-only election. We use the all-voter maps for future planning for Primary and General elections.”
The spokesperson for the Maricopa Recorder’s Office wasn’t on the same page, however. When contacted by JTN, that spokesperson explained:
“These hallway graphics do not serve a functional purpose, other than serving as a neat visual aid to voters who come to tour the facility. Please note that the Republican heat map is immediately adjacent to the Democratic heat map.”
So the Recorder’s Office supposedly maintains an internal team at taxpayer expense to collect and plot all the data just to produce nifty wall decorations? When later contacted about the conflicting statements, the Recorder’s Office spokesperson seemed to give JTN an equally nonsensical follow-up response.
“Later, when the recorder’s office was asked a clarifying question about the maps not being used to plan for future elections, the spokesperson reiterated that the maps in the hallway don’t serve a functional purpose, but then repeated the Elections Department’s explanation of heat maps being used for determining vote center locations.”
Perhaps Rick James has been moonlighting over at the Maricopa County Recorder’s Office.
Segment of Rick James from the classic Chappelle’s Show “Charlie Murphy’s True Hollywood Stories” skit
There is another angle of the MCTEC heat maps story that has not been touched on very much. In addition to theoretically referencing the maps to know which Voting Centers should experience the 19-in ballot image on a 20-in ballot Election Day “hiccup,”—it must be remembered MCTEC is also Maricopa’s centralized tabulation center. As with other municipalities like Detroit, Philadelphia, and Fulton County (GA)—centralized vote-counting centers are a tactic used by the Left to weaken election integrity. It’s very difficult to pull off any effort to manipulate the final vote totals when votes are being counted at hundreds of local neighborhood voting precincts. But when ballots are sent to a single tabulation center, then it only takes a handful of bad actors to manage the process and pull off any widespread ballot stuffing/manipulation scheme.
Segment from One America News’ (OAN) coverage of a Georgia state legislature hearing into election fraud in the 2020 presidential election. The video played during the hearing shows suitcases of ballots being pulled out from underneath a table in the Fulton County GA tabulation center on election night (Nov 3-4, 2020) by poll workers after telling Republican poll observers to go home for the evening.
MCTEC is the first stop for Early In Person & Drop Box ballots and where all ballots—besides those Election Day In Person ballots successfully run through tabulators at Voting Centers—would eventually be tabulated (e.g., where they finally get counted and added to the final vote totals).
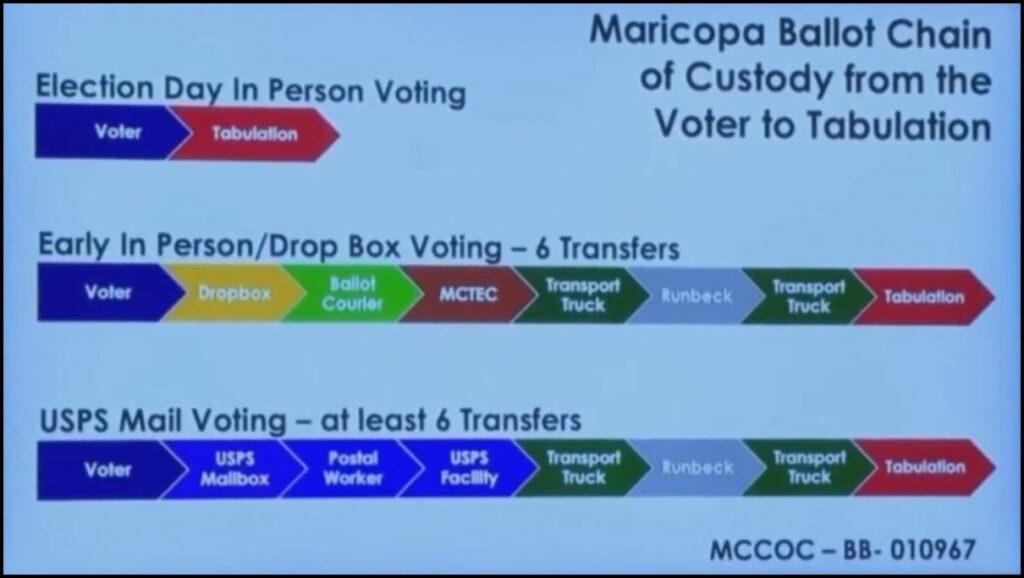
As open source investigator and supply chain expert witness Heather Honey testified to on the first day of the Lake v. Hobbs election contest trial, Maricopa County seemed to ignore Arizona election law and abandon any need to fill out most of the Chain of Custody (CoC) paperwork required for ballots arriving at or departing MCTEC on Election Day or afterwards. Adam Carter and Tracy Beanz also mentioned this was problematic during their livestream coverage of the trial.
As Ms. Honey detailed in the clip above, Maricopa failed to provide the Early Ballot Transfer Statements (marked Number 1 in the screenshot below) for Early In Person and DropBox ballots—coming from the precinct and drop box locations—into MCTEC on Election Day. They also failed to complete the Delivery Receipt Form (Number 2 in the screenshot below) as required by Arizona election law when the transport carriers were opened at MCTEC on or after Election Day. So Maricopa County has not, to date, provided any CoC documentation that could be used to determine exactly how many ballots MCTEC received or should have sent to the third-party vendor, Runbeck, for scanning and processing.
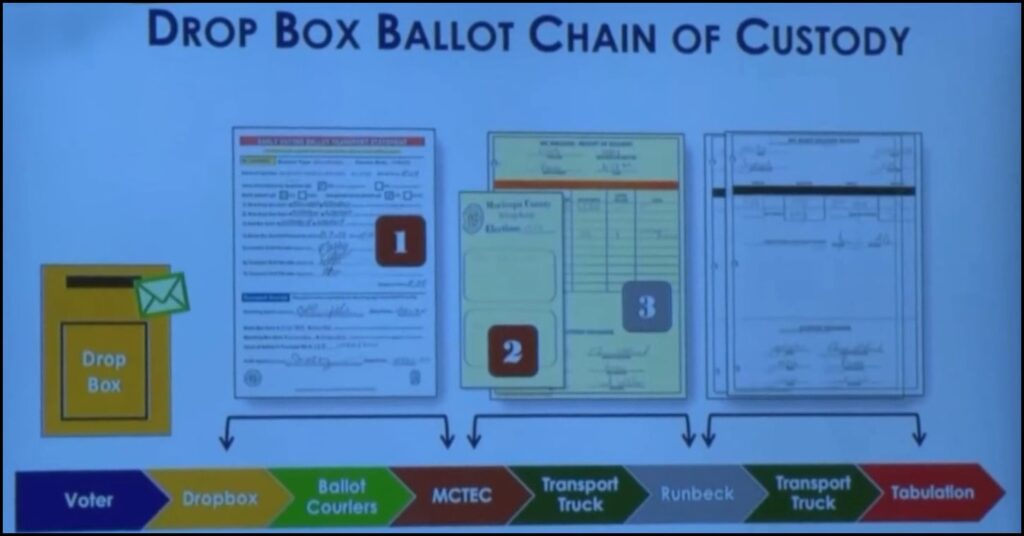
We also need to note the infamous “Door 3” ballots were also subject to these same CoC documentation requirements. Maricopa County Board of Supervisors Chairman Bill Gates and Recorder Stephen Richer put out a video explaining the Door 3 procedure on Election Day when news of the voting center tabulator issues began making headlines nationwide. Maricopa County has also failed to provide CoC documentation for the Door 3 ballots that could not be tabulated at the Voting Centers and instead were transported to MCTEC for processing.
On Election Day, the overall vote was coming in 75% for Kari Lake or more. Given the distrust of the mail-in balloting in the wake of the 2020 election, many—if not the majority—of Kari Lake voters had opted to wait to vote in person or drop off their ballots. Combined with the chaos created by the tabulator issues in mostly Republican-heavy Voting Centers, the volume of ballots arriving at MCTEC was overwhelming. The presence of the MCTEC heat maps very well might have been used to quickly identify which ballots shipments were arriving from the most heavily Republican-leaning Voting Centers.
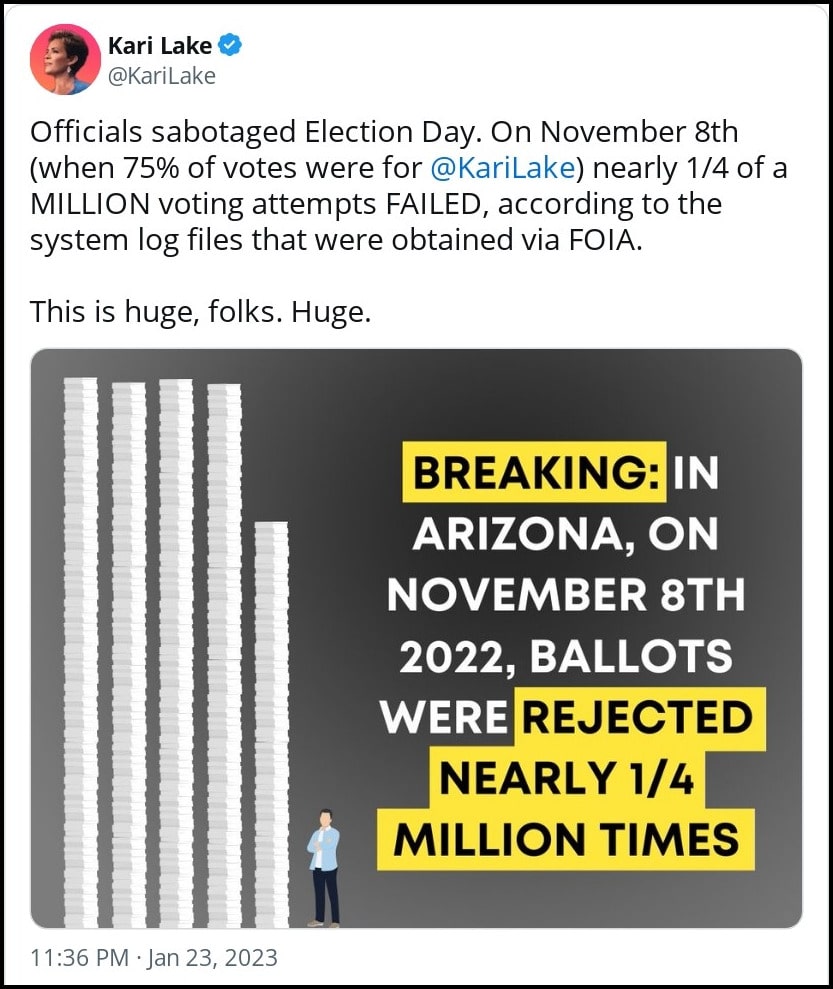
Given the complete lack of CoC documentation when the shipping containers were being opened, that could have made it very easy for unscrupulous elections officials at MCTEC to siphon off votes by simply omitting large numbers of ballots coming from those locations that were likely coming in 90% or more in favor of Kari Lake.
It is also interesting to note—when Maricopa did finally start releasing vote totals—they dropped the counts from the “Democrat-friendly” batches first and reported the ones from Republican-heavy locations nearly last. And the final total of the late reported Republican batches came in much less in favor of Kari Lake than pollsters like Rich Baris and others predicted based on their exit polling.
It was believed—at the time—this was being done by Maricopa election officials to help “control the narrative” that the Democratic candidate, Katie Hobbs, had a lead that Kari Lake simply could not overcome.

But is that really the reason? Could it have been Maricopa officials needed the extra time to replace ballots omitted in order to get the total count by location reasonably believable? After all, if a poll observer—for example—at a certain Voting Center knew about 10K ballots were sent to MCTEC, but the batch total reported from the location wound up being closer to 5K, which would have stuck out like a sore thumb. Maybe they needed time to “get the numbers right” location by location.
Unfortunately, the heat map overlaid with impacted voting locations was not available in time for the initial election contest trial in December or the recent private conference held by the three-judge panel of the Arizona Appellate Court on the appeal of the verdict. Kari Lake put on an update last week on the status of the case on her Truth Social account.
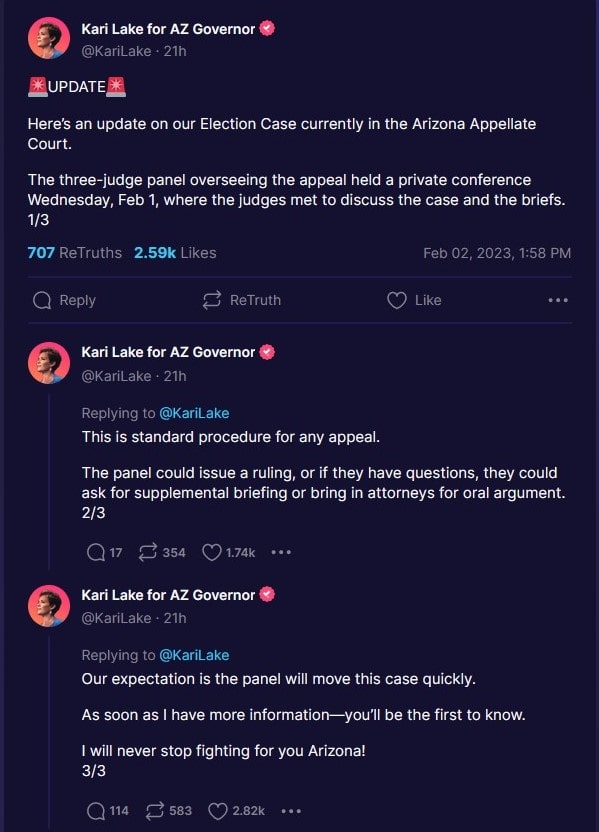
Regardless of which side prevails at this level and above, we fully expect the losing side(s) will continue to appeal the decisions until it reaches the U.S. Supreme Court. So it is a waiting game to see how quickly the case works its way through the court system and if the Supreme Court justices elect to grant it a final hearing.

The Washington Pundit | Speak Truth To Power
Follow me on Truth Social @AdamCarter


